What to Work on Next?
Prioritizing your work to focus on what really matters
By measuring impact and effort we can determine where to spend our time and resources in making the greatest impact.
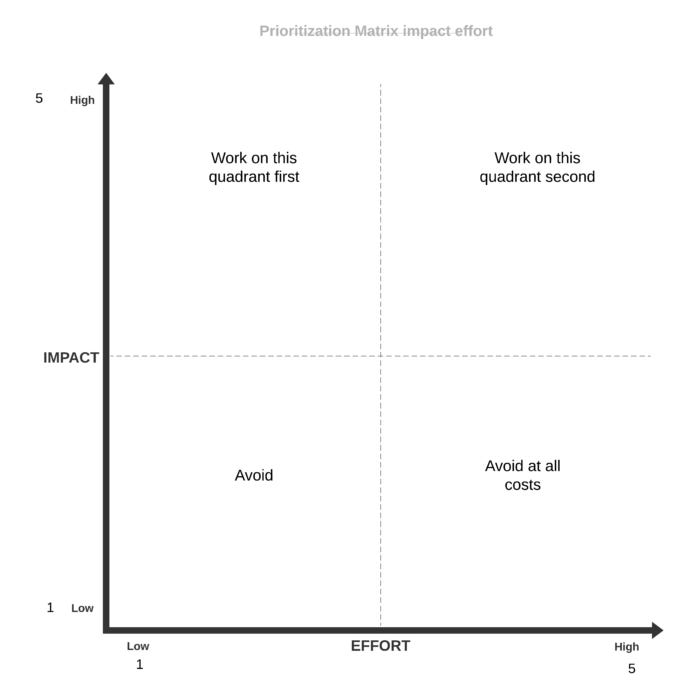
This prioritization methodology measures impact and effort on a scale of 1-5. Impact is defined as the reach, impact and revenue that a project brings. Effort is measured as the time, resources and capital that the project will cost.
You can calculate the total score by impact / effort.
You want to focus on tasks that are high impact low effort, with secondary focus on tasks that are high impact / high effort. You want to avoid tasks that are low impact / high effort at all costs.
NOTE: To keep things simple we are weighing all variables the same, but you could weigh any variable based on your preference.
Using the Prioritization Methodology
Calculating Impact
We will be comparing two competing projects: The first project will upgrade your e-commerce payment system and the second project will add a feature to your application that will allow for Trello integration.
Upgrade Payment System
Reach POS: 5,000 customers per month. Score is 5/5
Impact is high since you are targeting the source of your revenue stream which is important to your business. Score is 5/5
Revenue: scores high since this is your e-commerce lifeline. score is 5/5
Total Impact score for payment system upgrade is : 5
Trello Integration Feature Scoring
Adding a new feature to your web application that allows users to integrate with Trello.
Reach 300 of 5,000 customers have requested Trello integration. Score is 2.5/5
Impact is moderate since only a few users have requested this feature. Score is 2/5.
Revenue: potential is low, since adding this feature will not bring additional revenue. Adding the feature might bring customer loyalty, but no tangible revenue generation. Score 2/5.
Calculating Effort
Upgrade Payment System
Time: You will be using a payment provider which provides out of the box integration with your CMS platform, so the time required will be minimal. There will be planning and testing involved, but implementation time frame will be short. Score 2/5
Resources: This does not require additional staff. Score 1/5
Cost: There is no upfront cost to upgrade. Transaction costs, will be lower that those with your existing system. Score 1/5.
Total effort score is the average : 2+1+1 / 3 = 1.33
Trello Integration
Time: Your development team tells you that adding this new feature will require 2 sprints (4 weeks) of development time. Score 2/5.
Resources: This feature will require two full time resources. Score 2.5/5.
Cost: The cost of two full time resources plus opportunity costs of not working on other projects. Score 3/5.
Total effort score is the average : 4+2.5+3 / 3 = 3.17
You can now graph it on the matrix, or you can come up with a priority score by dividing Impact by effort. 2.17/3.17 =0.684
As you can see the payment system is a much worthier project than building the Trello integration feature (3.76 vs. 0.684). The POS project can be quantitatively measured to be 5.49 times better than working on the Trello feature.
By quantifying what to work on you can direct resources and capital on projects that really matter. By following this methodology you will work on projects that will make an impact to your organization and customers.
Article originally appeared on Gatherthink.com.


